


As we countdown to the beginning of the 2019-20 season, we say goodbye to the decade that was the 2010s: more UConn dominance, major statements from Baylor and six title games for the Irish highlighted the last 10 years.
But that doesn’t tell the whole story. There is more to college basketball than national championships, and any deep run in the tournament is special in its own way. To get a snapshot of one aspect of how well each conference performed in the 2010s, here are charts explaining the amount of teams each league sent to the second weekend of the Big Dance:
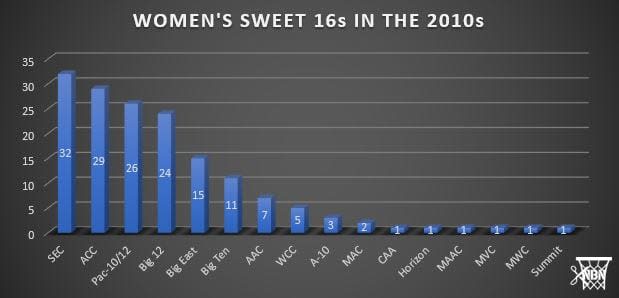
Chart A displays the conferences that had teams get to the Sweet 16 in the 2010s and how many they sent. The SEC finished with the most with 32, slightly better than the ACC’s 29. The Pac-12 was next at 26, followed by the Big 12 with 24, sitting a good distance from fifth. The margin between the last power conference and first mid-major league was relatively small, with the AAC coming within four of the Big Ten’s mark of 11.
Sixteen conferences sent a squad to the Sweet 16 at least once, 10 of which were non-majors. Only four of those 10 accomplished it more than once. The AAC led the way with seven, with Connecticut responsible for six of them, and Louisville holding the other appearance from its one season in the league. It was a somewhat similar story on the WCC as four of its five second weekend trips came via Gonzaga – BYU claiming the final go.
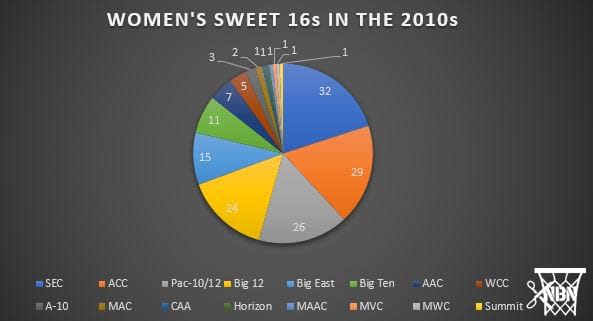
The same information is presented in a different style in Chart B.

This chart allows a closer look at the major conferences only. There is a clear top four that have separated themselves from the rest of the pack – the SEC, ACC, Pac-12 and Big 12 – with the Big East and Big Ten lagging behind. Some of these appearances can be attributed to teams that no longer play in those conferences. Credit is given to whichever conference a school participated in during that given season, not what league the program is in now.
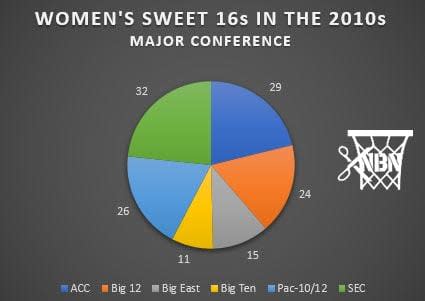
Chart D represents equal information to Chart C but through an alternate perspective.
The six power conferences together grabbed 85.6 percent of the Sweet 16 appearances from 2010-2019, leaving only 14.4 percent for the rest of Division I. The SEC, ACC, Pac-12 and Big 12 alone combined for 69.4 percent of the total 160 second weekend trips.
